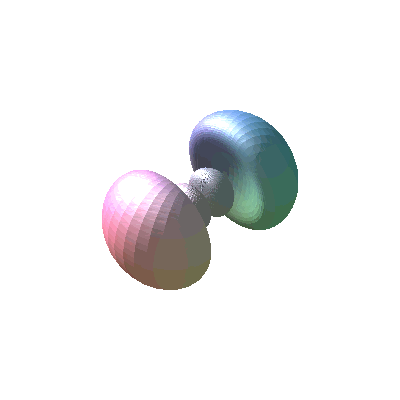
We consider here
the relationship between 3![]() 3
3![]() 3
3![]() 3
3![]() First we start with only the angular parts. For
First we start with only the angular parts. For ![]()
![]() these are
the spherical harmonics
these are
the spherical harmonics ![]()
![(Typesetting:-mprintslash)([p[1] :=
1/4*6^(1/2)*sin(theta)*exp(I*phi)/Pi^(1/2)], [1/4*6^(1/2)*sin(theta)*exp(I*phi)/Pi^(1/2)])](3pOrbitals_8.gif)
![(Typesetting:-mprintslash)([p[-1] :=
1/4*6^(1/2)*sin(theta)*exp(-I*phi)/Pi^(1/2)], [1/4*6^(1/2)*sin(theta)*exp(-I*phi)/Pi^(1/2)])](3pOrbitals_9.gif)
These are complex.
Note that the ![]() dependence is the same; it depends only on l and the absolute value of m.
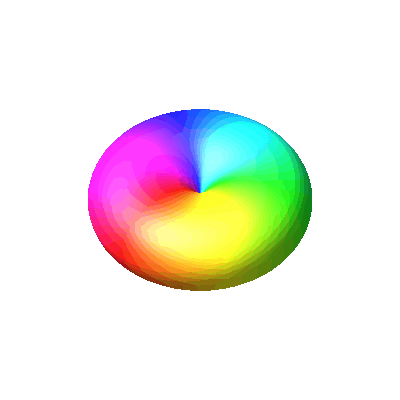
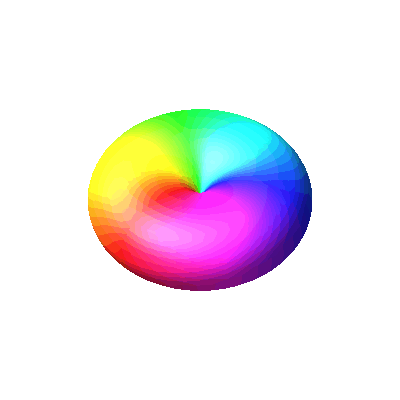
We can plot the squares of the magnitudes as a function of
dependence is the same; it depends only on l and the absolute value of m.
We can plot the squares of the magnitudes as a function of ![]() and
and ![]() and colour them according to the
phase. Red means a phase of zero (positive real number) and cyan means a phase of
and colour them according to the
phase. Red means a phase of zero (positive real number) and cyan means a phase of ![]() (negative
real number). The phase runs in opposite directions for these two spherical harmonics. The
z axis is pointing up and towards the
viewer, the x axis
is pointing forward and to the left and the y axis is back and to the right.
(negative
real number). The phase runs in opposite directions for these two spherical harmonics. The
z axis is pointing up and towards the
viewer, the x axis
is pointing forward and to the left and the y axis is back and to the right.
 |
 |
| Y1,1 or p1 | Y1,-1 or p-1 |
If we take linear combinations of these we get the more usual real px and py angular functions:
![p[x] = (p[1]+p[-1])/sqrt(2)](3pOrbitals_16.gif) and
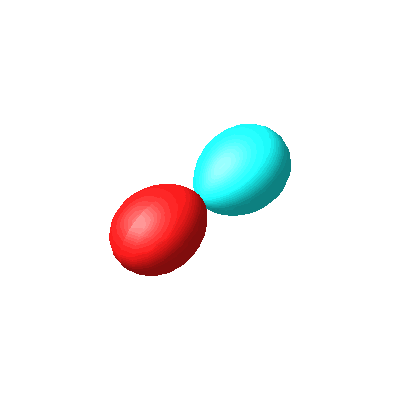
and  . We can plot them in the same way, plotting their squares as a
function of
 ![]() and
and ![]() . Again red means a phase of zero (positive real number) and cyan means a phase of
. Again red means a phase of zero (positive real number) and cyan means a phase of
![]() (negative real number).
(negative real number).
![(Typesetting:-mprintslash)([p[x] :=
1/2*3^(1/2)*sin(theta)*cos(phi)/Pi^(1/2)], [1/2*3^(1/2)*sin(theta)*cos(phi)/Pi^(1/2)])](3pOrbitals_20.gif)
![(Typesetting:-mprintslash)([p[y] :=
1/2*3^(1/2)*sin(theta)*sin(phi)/Pi^(1/2)], [1/2*3^(1/2)*sin(theta)*sin(phi)/Pi^(1/2)])](3pOrbitals_21.gif)
 |
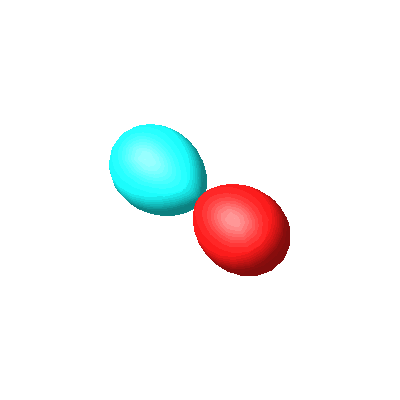 |
| px | py |
These functions
have angular nodes at certain ![]() values. cos(
values. cos(![]() ) is zero for
) is zero for ![]() in the opposite directions of 90 and
270 degrees, giving a single vertical nodal plane that includes the y and z
axes. Likewise sin(
in the opposite directions of 90 and
270 degrees, giving a single vertical nodal plane that includes the y and z
axes. Likewise sin(![]() ) is zero at 0 and 180 degrees giving a vertical nodal plane that
includes the x and
z axes. Notice that if we were working
with, say, m=3
and m=-3,
the phase would show three repeated colour sequences in a full turn, we would get cos(3
) is zero at 0 and 180 degrees giving a vertical nodal plane that
includes the x and
z axes. Notice that if we were working
with, say, m=3
and m=-3,
the phase would show three repeated colour sequences in a full turn, we would get cos(3![]() ) and
sin(3
) and
sin(3![]() ), and there would be three vertical nodal planes.
), and there would be three vertical nodal planes.
So far we have
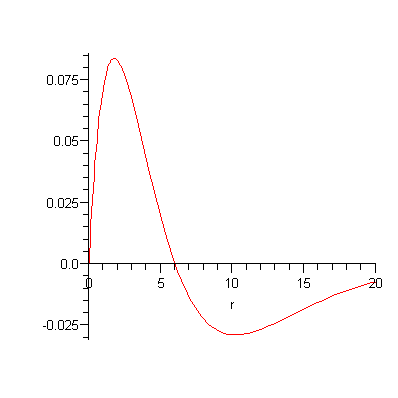
only plotted angular functions, but now we focus on the 3![]() hydrogen orbital, which is the
product of the angular function above and a radial function, which is given in atomic units
as
hydrogen orbital, which is the
product of the angular function above and a radial function, which is given in atomic units
as

(To convert to SI
units, divide every r by a0
and multiply the expression by ![]() .) So there is a radial node at r = 6. If we put both the radial and angular
parts together we get the complete function
.) So there is a radial node at r = 6. If we put both the radial and angular
parts together we get the complete function
![(Typesetting:-mprintslash)([`3p`[x] :=
1/54*2^(1/2)*r*exp(-1/3*r)*(4-2/3*r)*sin(theta)*cos(phi)/Pi^(1/2)],
[1/54*2^(1/2)*r*exp(-1/3*r)*(4-2/3*r)*sin(theta)*cos(phi)/Pi^(1/2)])](3pOrbitals_34.gif)
The subscripts of
the orbitals (x, x2-y2 etc.) are found by converting the spherical coordinates back to cartesian coordinate.
Here we see that rsin(![]() )cos(
)cos(![]() ) is x, so
we can write it as
) is x, so
we can write it as

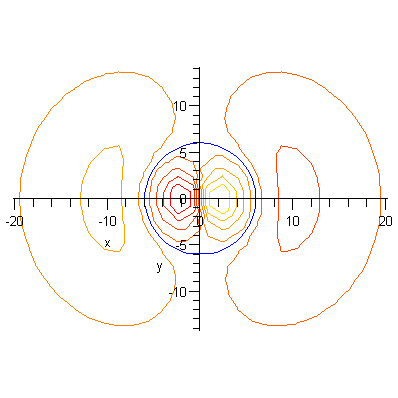
Note that we get rid of all the angles but we are allowed to leave rs in the expression. We can make a contour plot of a section of the wavefunction through the x-y plane. The radial node is the blue circle. The y axis is an angular node (plane in 3-D).
The usual plot is a 3-D plot of a contour of the wavefunction enclosing a certain probability. The 90% contour for the 3px orbital is at a wavefunction value of 0.00303 in atomic units (it is non-trivial to calculate this number).
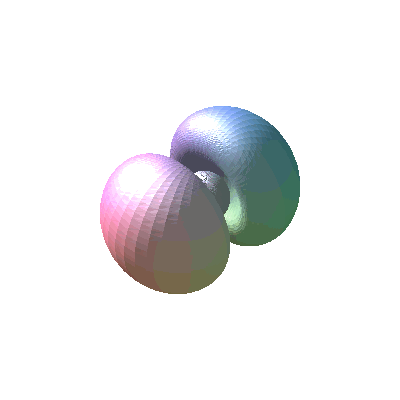
We can see the inner lobes a bit more clearly if we look at a contour that encloses less probability.
