REPORT ON THE HUMAYMA EXCAVATION PROJECT FOR 2002
John Peter Oleson, Gregory S. Baker, Andrew N. Sherwood, Erik de Bruijn, M. Barbara Reeves,
Heather M. Ambrose
INTRODUCTION
The first season of a two-year geophysical survey was carried out at Humayma from 19 June 2002 to 11 July 2002. The team consisted of Prof. John P. Oleson, University of Victoria (Project Director), Dr. Gregory S. Baker, University at Buffalo (Project Co-Director), Dr. Andrew Sherwood, University of Guelph (Assistant Director), Mr. Erik de Bruijn, University of British Columbia (Assistant Director), Ms. M. Barbara Reeves, University at Buffalo (Assistant Director), Ms. Heather Ambrose, University at Buffalo (Geophysics Assistant), Mr. Matthew Pelc, University at Buffalo (Field Assistant). Mr. Jamal Safi was assigned by the Department of Antiquities as a Trainee in Geophysical Survey, and Mr. Sate Massadeh served as the Department Representative. We are very grateful to Dr. Fawwaz al-Khraysheh, Director of the Department of Antiquities for a permit to conduct work at the site once again, and to Drs. Pierre and Patricia Bikai of the American Schools of Oriental Research in Amman for their invaluable logistical support.
Funding was provided by the Social Sciences and Humanities Research Council of Canada and the American Schools of Oriental Research for a study season (2002) and two seasons of excavation (2003-2004). These grants have been supplemented by a generous grant from the Taggart Family Foundation for a geophysical survey with ground-penetrating radar, magnetic gradiometer, and resistivity equipment in 2002 and 2003. The ASOR Committee on Archaeological Policy also provided a timely grant in support of the project.
Since 1986 Oleson has directed two seasons of intensive field survey and seven seasons of excavation at the Nabataean through Abbasid period site of Humayma, ancient Hawara. Although large areas of the site remain unexcavated, we now have a sound understanding of the stratigraphic sequence, a detailed database and typology of the ceramics, and excellent documentation of occupation areas and structures from every period of Hawara’s history. For the next two years we intend to focus efforts on the Roman Fort (E116), the earliest large Roman fort known in Jordan, and one of the very few examples of an early imperial fort in the entire Near East, and the surrounding civilian settlement or vicus.
Previous seasons of excavation throughout the site have taught us a great deal about the water supply systems and other local resources (Oleson 1997; 2001a; Forthcoming "Water Supply"), local Nabataean culture and habitation patterns, domestic and sacred architecture and related cultural assemblages during the Roman and Byzantine periods, and the private and palatial architecture of the Early Islamic period, along with its surprisingly rich and wide-ranging associated artistic traditions (Oleson et al. 1999; Foote 1999). We can now sketch at least in outline the multi-cultural history of Hawara (Oleson 2001b).
The objective of the next stage of the project is to reach an understanding of the motives behind the Roman military occupation of Hawara (roughly the period between 110 to 400 A.C.), the character of "Roman" culture at the site, and the nature of the cultural interaction between soldiers and civilians at a small desert settlement. The results will also elucidate the evolving nature of the fortified eastern frontier of the Roman Empire (often referred to by the Latin term limes) from its inception through the tumultuous third and fourth centuries. The ultimate goal of the whole multi-year project is interpretation of the resulting archaeological data in combination with historical sources and data from comparable sites in Jordan and related areas to reconstruct the circumstances of Hawara's foundation, growth, and decline. This synthetic interpretation will in some cases allow extrapolation to higher-level explanations of the process of sedentarization, of changes in settlement design and function, and of technological innovation (especially construction and hydraulic technology) in this region in antiquity.
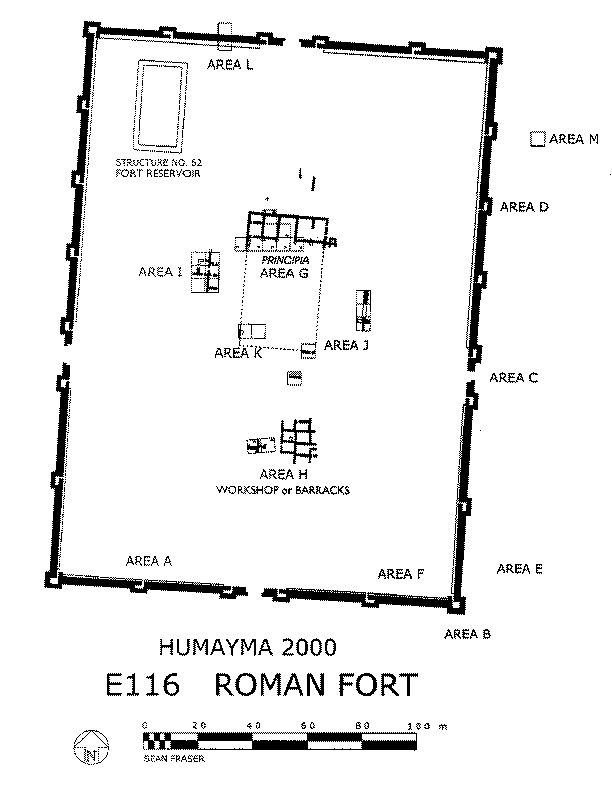
We have already excavated enough of the Roman fort in Field E116 to understand the chronology and plan of the fortification wall and the interior network of parade ground and streets, and to define the character of two major internal structures: the Principia (headquarters building and shrine) and Praetorium (commander's residence). Relatively small areas of the barracks, a workshop, and possible stables or granaries have also been probed. Although evidence for the history and development of this large military complex is still fragmentary, the spectacular results of our excavations have already had a marked effect on the very vigorous field of Roman military history in the Near East (Kennedy 2000: 182-83; Gregory 1996: 196).
Although we have a good idea of the general plan of the fort, and the location of some of the major structures from aerial balloon photos and excavation, the most efficient way to plan further excavation-and to obtain a complete plan of the fort without decades of excavation-is through geophysical survey. The same is true for the large vicus where the mud-brick walls have melted back into the soil. The plans generated by analysis of the field data gathered this summer will allow us to excavate more effectively inside the fort and in the vicus in 2003 and 2004. Combined with the plans produced by the geophysical survey, our future excavations will produce a more accurate picture of this very important Roman fort and will allow us to define its relationship with the civilian settlement of Hawara.
ARCHAEOLOGICAL GEOPHYSICS SURVEY
Geophysical techniques provide a non-invasive means of gathering information about subsurface archaeological structures, minimizing excavation that may be too time consuming or destructive to a sensitive site. Geophysical data, however, must be quality controlled using information gathered from existing or future excavations in order to assure the validity of the interpretations.
In cooperation with an archaeological team directed by Prof. J.P. Oleson, a small geophysical team headed by Dr. Baker conducted the field component of an initial archaeological geophysics survey at Humayma in southern Jordan from 21 June through 11 July 2002. The objectives of the work were to: 1) identify buried structures to assist in future excavation and site conservation work; 2) determine the strengths and weaknesses of each geophysical technique in relation to the Humayma site for future work; and 3) develop innovative methods for synthesizing and displaying the complex three-dimensional images generated during the geophysical survey. Three separate techniques (electrical resistivity, magnetic gradiometry, and ground-penetrating radar) were used to collect data. The preliminary results are presented below.
Description of Geophysical Techniques
The three geophysical tools used for collecting geophysical data were chosen because of their proven success in other archaeological geophysics surveys. Some techniques-e.g., seismic and gravity-were not used because the predicted depth-to-target was less than 2 m (too shallow for traditional seismic techniques) and the targets were generally closely spaced walls (causing too much clutter to acquire robust gravity data). Additional techniques (e.g., the electromagnetic induction method) may work well at the Humayma site, but were not used because of logistical and resource constraints. Because of the potential for interference, only one tool was used for data collection in a particular area at a time.
Electrical Resistivity
The electrical resistivity technique is based on Ohm's Law, which states that resistance equals voltage divided by electrical current. Simply put, if the voltage across a known current path can be measured, the amount of resistance of the intervening material can be calculated. Thus, if a device with constant electrode spacing is towed across the ground surface, variations in the electrical resistance of the subsurface can be measured. There is generally a sufficient contrast between the electrical properties of archaeological features (e.g., stone used to construct walls) and the surrounding loose sand and soil so that a map of the electrical resistance can indicate buried features.
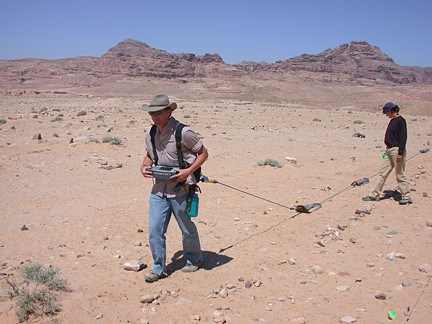
The unit used for the survey was an OhmMapper TR1 capacitively-coupled resistivity meter from Geometrics Inc. of San Diego (Figure 1. Deployed OhmMapper resistivity unit. The unit consists of an array of two antennas each with power units, towed by an operator using a data console for recording. A second person, standing just to the left of the operator, aids in clearing a path along the profile.). This unit collects electrical resistivity data significantly faster than the traditional galvanically-coupled (DC) resistivity systems. The transmitter and receiver separation distance for all surveys was 1.25 m (optimized from initial testing). One data point was collected every second while towing the array along a profile line, and "marks" at regular spacing along the profile, input by the operator, were used to locate the data in space.
Magnetic Gradiometry
The magnetic gradiometry technique relies on the principle that nearly all materials generate a secondary magnetic field-known as induced magnetism-when exposed to a strong primary magnetic field. The strength of the induced magnetism is related to a property called magnetic susceptibility. The Earth's magnetic field represents the strong primary magnetic field, thus all materials on Earth with a non-zero magnetic susceptibility exhibit some degree of induced magnetism. (Note: This should not be confused with the remanent magnetism of ordinary magnets, which is generally many orders of magnitude stronger). A magnetometer is an instrument that can be used to measure the sum total of the Earth's magnetic field plus the induced magnetic fields of all the surrounding materials. Differences in magnetic susceptibility (related to different materials, e.g., stone, mud brick, loose sand, or soil) will result in varied strengths of induced magnetism. These changes can be measured with a magnetometer.
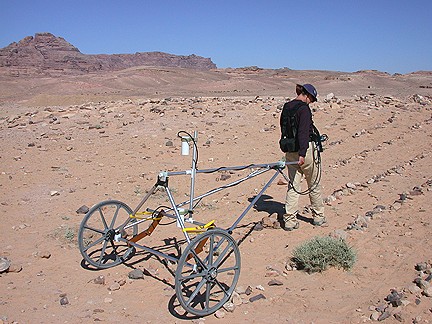
A magnetic gradiometer is a unit with two magnetometers placed one above the other, in which the signal from the first (upper) is subtracted from the signal of the second (lower), to yield the magnetic gradient. This has several advantages: 1) magnetic "signal" from deeper (i.e., non-archaeological) sources tends to be reduced; and 2) the effects of magnetic (solar) storms and the Earth’s diurnal fluctuations are removed. A Geometrics, Inc. G-858 MagMapper cesium-vapor magnetic gradiometer attached to a non-magnetic cart was used for the surveying (Figure 2. Deployed magnetic gradiometer. The two magnetometers are the vertical cylinders with attached cables connected to a console worn by the operator.). The vertical separation of the magnetometers was 0.75m for all data. As in the case of the resistivity data, one data point was collected every second while moving the cart along a particular profile, and measured marks (input by the operator) were used to locate the data in space.
Ground-Penetrating Radar
Ground-penetrating radar (GPR) operates on the same principle as aircraft radar, in that a controlled pulse of electromagnetic (EM) energy is transmitted, reflected off an object, and recorded by a receiver. The time it takes the pulse of energy to travel to the object and back is related to the distance it travels and its velocity. Unlike aircraft radar (where we know the propagation velocity of EM waves in air), the velocity at which the EM energy travels in the ground depends on the material. Otherwise, the same principles hold-EM reflections arise when encountering different material. The GPR technique, therefore, is useful for locating buried objects having material properties (i.e., EM propagation velocity) different than the surrounding material.
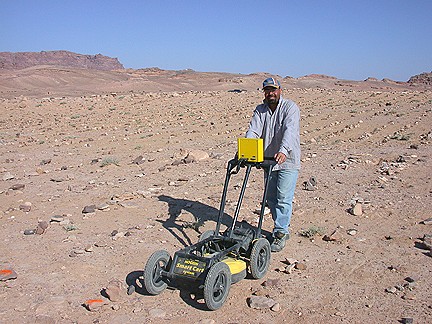
The GPR unit is wheeled across the ground with the antennas pointing downward, and the reflected pulse originating from the transmitting antenna is recorded by the receiving antenna. The data are initially plotted in time but subsequently converted to depth once the velocity is calculated by analyzing subsurface point diffractions within the data. Once the depth is calculated, depth maps or "depth slices" can be generated that show the reflectivity at various depth ranges in the subsurface (useful for identifying deeper structures located below shallower structures). Data were collected using a Noggin Plus 250 ground-penetrating radar unit from Sensors and Software Inc. of Toronto (Figure 3. Deployed GPR unit.) The transmitting and receiving antennas are located in the housing beneath the wheel frame. The operator runs the unit from the console mounted on the push bar. This unit includes an odometer wheel that controls the data collection rate. For all data, points were collected every 0.25m along the profiles.
DATA COLLECTED WITHIN THE ROMAN FORT
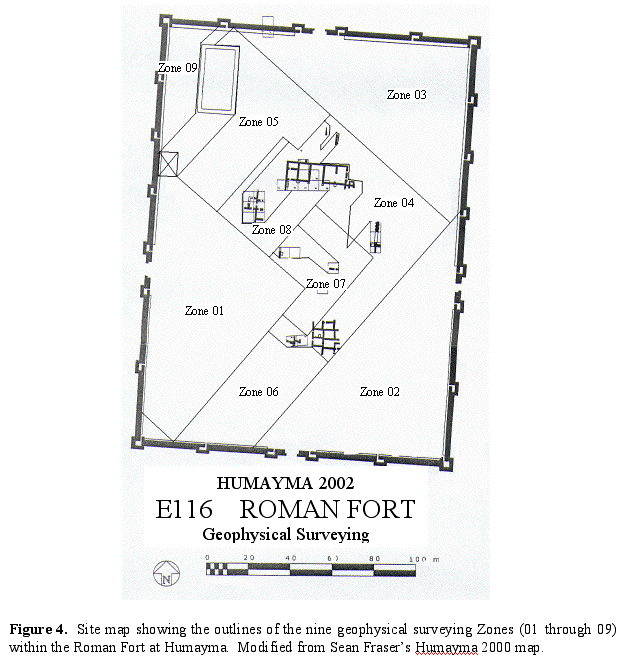
The region within the exterior walls of the Roman Fort (E116) was subdivided into nine manageable zones for the geophysical survey (Figure 4. Site map showing the outlines of the nine geophysical surveying Zones (01 through 09) within the Roman Fort at Humayma. Modified from Sean Fraser's Humayma 2000 map.). The main objective of the geophysical surveying in this region was to locate features within the Fort. The boundaries of the zones extended to the interior face of the Fort wall, and to the edges of existing excavations, rock piles, dirt mounds, and other significant barriers. Each zone had a baseline oriented parallel or perpendicular to a diagonal (formed by joining the NE and SW corners of the Fort). Given these constraints, Zones 01-05 were designed to cover the maximum total area within the Fort, and Zones 06-09 were positioned to fill subsequent gaps in coverage.
Site Preparation
Geophysical data were collected using each tool along a series of profiles spaced 1m apart in the nine Zones within the Fort. The profiles were all oriented parallel or perpendicular to the main diagonal of the Fort because the majority of the structures are oriented roughly north-south/east-west; thus, parallel or perpendicular profiles to these structures would have resulted in higher potential for error or missed features. Data along crossing profiles were not collected because the profile line spacing (1.0 m) resulted in sufficient coverage.
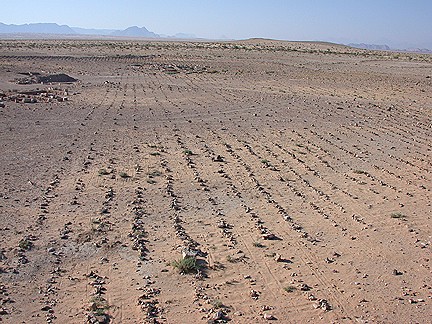
Along the profiles, all rocks larger than 0.05 m diameter were raked to the sides of the survey paths (Figure 5. Site preparation along 1.0 m spaced profile lines). This site preparation was necessary to: 1) improve data quality (rocks wedged between the radar antennas and the ground decreases coupling and generates noise; large-sized surface rocks increase noise on the magnetic data); 2) increase the ease and speed with which each tool could be pushed/pulled along the profile lines; and 3) provide a mechanism for guiding the trajectory of the equipment by maintaining line spacing and straightness. The zones were also scanned to identify and remove surface metallic debris (metal cans, old rebar, etc.) that would significantly interfere with the magnetic gradiometer. After initial site preparation on Zones 01 and 02, collection of geophysical data was begun by some members of the team while the others continued site preparation in other zones.
The exact positions of the baselines and profile lines for each zone were generated using measuring tapes and measured string/cord. Colored spray paint was used on small rocks to act as guides during the process. Major corners and crossing points were marked with rebar posts and surveyed using a Topcon digital electronic theodolite with attached EDM. Elevations were recorded within each zone on a 10m by 10m grid.
PRELIMINARY PROCESSED DATA
Only the GPR and magnetic gradiometer were used to collect data within the Fort as preliminary trials with the electrical resistivity unit had indicated that the zones were too small to provide sufficient data density for proper interpretation. Once the GPR and magnetic data were collected, preliminary processing steps were performed to allow for an initial interpretation.
Magnetic Gradiometry
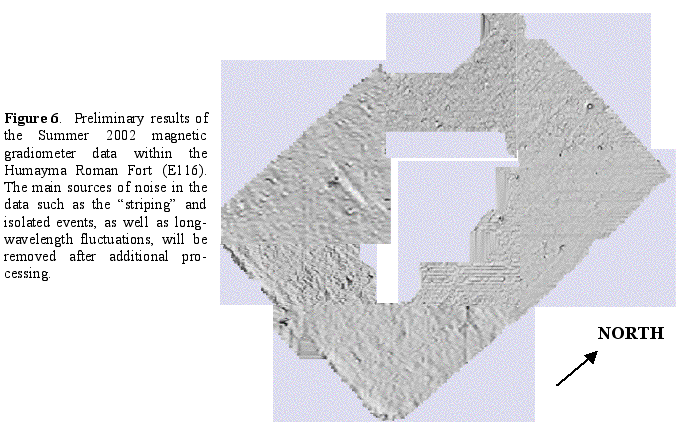
The steps necessary for preliminary processing of magnetic gradiometer data are as follows: data transfer from the instrument console to laptop computer; input of spatial geometry (indicates where each data point is located in a coordinate system); removal of spurious data (such as data spikes, zeroed data, etc.); generation of a shaded relief map of the magnetic gradient amplitudes. (Figure 6. Preliminary results of the Summer 2002 magnetic gradiometer data within the Humayma Roman Fort [E116]. The main sources of noise in the data such as the "striping" and isolated events, as well as long-wavelength fluctuations, will be removed after additional processing.)
The following steps will be completed in the near future to enhance the results of the data: integration of the data with the TOPCON survey data to position more accurately the Zones relative to each other, including orienting the data to true north; removal of step functions within the data caused by time delays during collection; removal of short- and long-wavelength noise; determination of the depth of investigation through forward modeling; editing of specific profiles that sufficiently fluctuate and cause "striping" in the data parallel to the profile direction.
Ground-Penetrating Radar
The GPR data requires significantly more digital processing to render it into a usable form. The following steps were performed to generate depth slices of the data: data transfer from the console to laptop computer; input of spatial geometry; scaling (to enhance small amplitudes from deeper reflections); editing of "bad" data and noisy profiles from within each zone; determination of velocity by analyzing point diffractions within the data profiles; polarity rotation of 180 degrees on every other profile line (because they were alternatively run in opposite directions during data collection); migration of data (to collapse diffractions and shift reflectors to their proper subsurface position); convert from time to depth (using the calculated velocity of 0.12 metres/nanosecond); merge the profiles in each zone into a data volume; "slice" the data volume to examine the horizontal distribution of reflectivity at specific depths.
In addition, the following procedures will be conducted in the near future to further enhance the GPR data: integration of the data with TOPCON elevation and spatial data to improve the positioning of the data; reanalysis of the data to improve the velocity estimate (if necessary) for improved depth control; generation of a specific color palette for plotting the data; development of an innovative methodology for integrating the GPR data with the magnetic gradiometer data; merging of several depth slices back into a data volume for 3-D visualization.
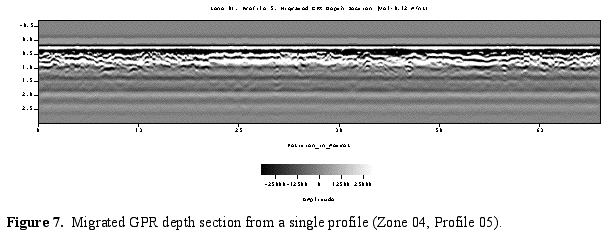
At the Humayma site, the deepest penetration of signal was 2.5 m, with an average maximum penetration of about 1.5 m. Although the individual GPR profiles (e.g. Figure 7) are high quality and can be useful in identifying buried structures, the development of depth slices by combining the profiles within a zone yields the best results.
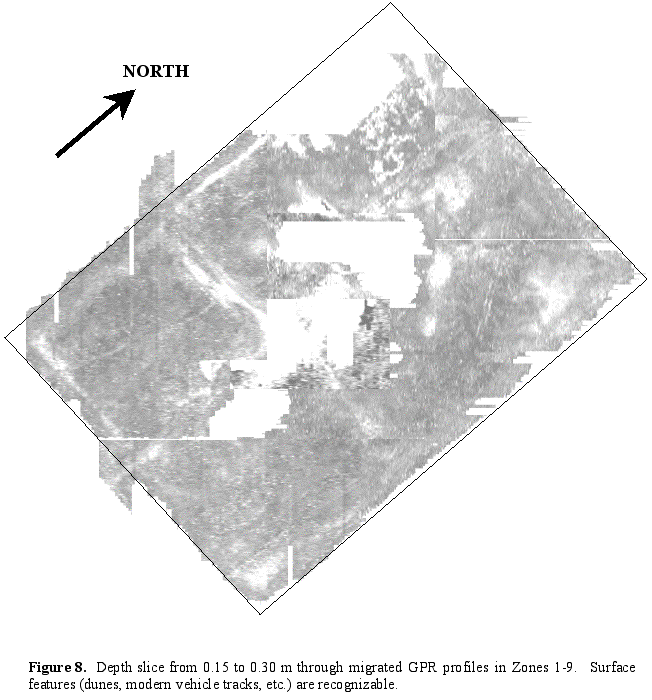
One method of quality control in assembling the profiles into depth slices is to examine a very shallow slice and identify recognizable surface features. Figure 8 is a slice from 0.15 to 0.30 m depth, and features such as modern dunes (light colored patches), modern vehicle tracks (thin double parallel lines), animal trails (thin single lines), and recent low rock walls (coherent linear features with variable amplitudes) are visible. White (blank) polygons within the Fort represent regions where no data has been collected. These areas include existing excavations, significant rock/dirt piles, and modern structures.
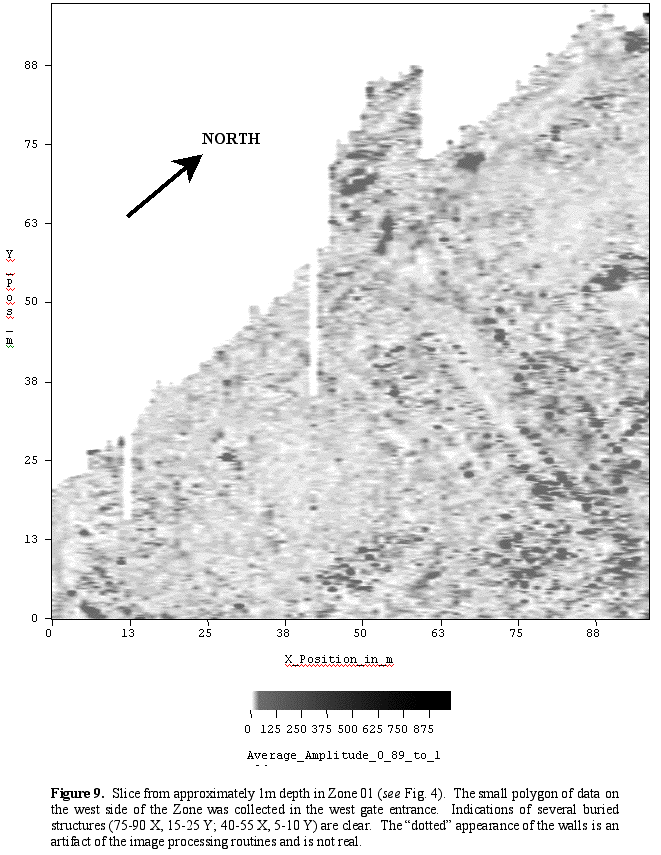
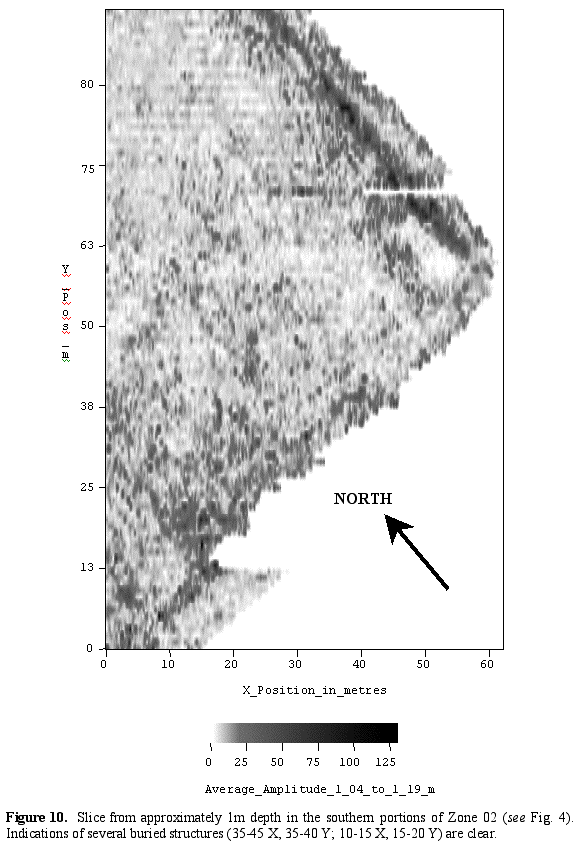
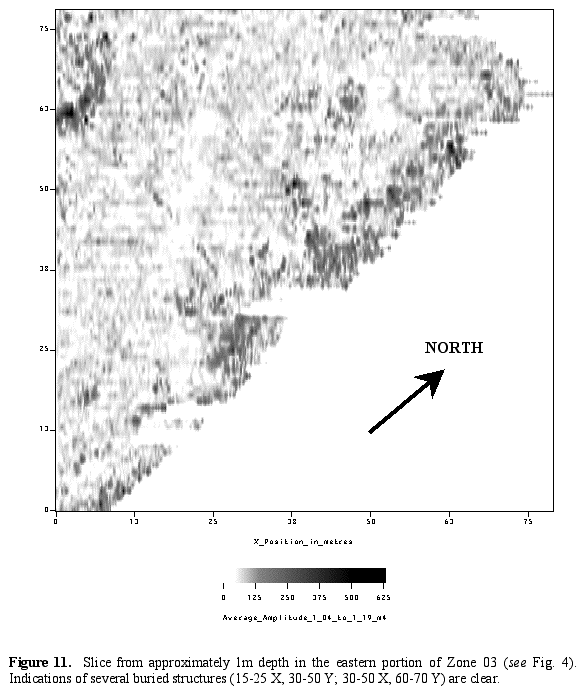
Preliminary inspection of the data indicates that slices from 1 m depth yielded the best results. Horizontal slices of the migrated GPR profiles at this depth from Zones 01, 02, 03, and 04 are shown in Figures 9-13.
Figure 9. Depth slice from 0.15 to 0.30 m through migrated GPR profiles in Zones 01-09 (fig. 4). Surface features (dunes, modern vehicle tracks, etc.) are recognizable.
Figure 10. Slice from approximately 1m depth in Zone 01 (fig.4). The small polygon of data on the west side of the zone was collected in the west gate entrance. Indications of several buried structures (75-90 X, 15-25 Y; 40-55 X, 5-10 Y) are clear. The "dotted" appearance of the walls is an artifact of the image processing routines and is not real. Buried walls are identified as coherent, linear features. The "dotted" pattern of these structures is an artifact of the image-processing algorithm that will be addressed in the near future.
Figure 11. Slice from approximately 1m depth in the southern portions of Zone 02 (fig. 4). Indications of several buried structures (35-45 X, 35-40 Y; 10-15 X, 15-20 Y) are clear.
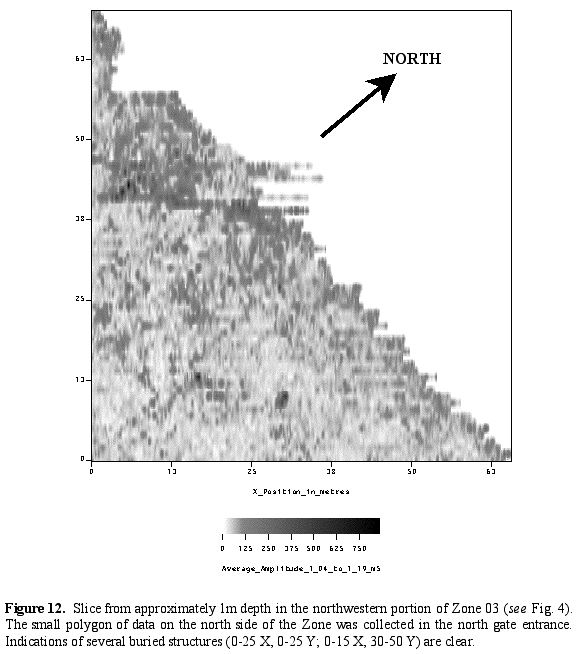
Figure 12. Slice from approximately 1m depth in the northeastern portion of Zone 03 (fig. 4). The small polygon of data on the north side of the zone was collected in the north gate entrance. Indications of several buried structures (0-25 x, 0-25 Y; 0-15 X, 30-50 Y) are clear.
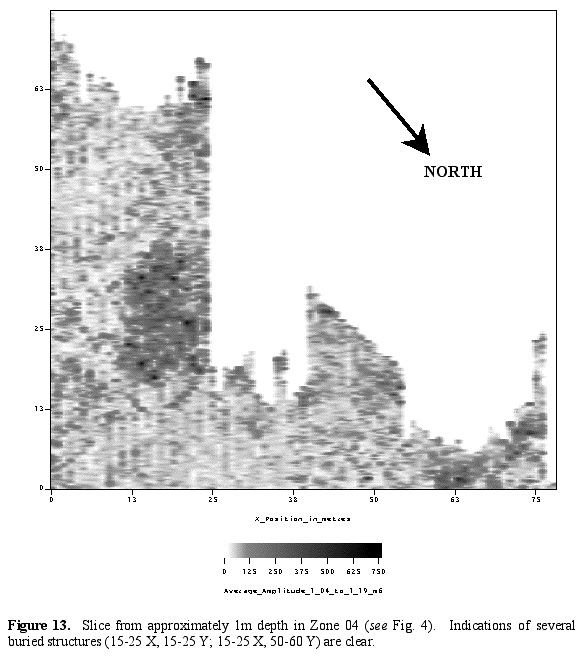
Figure 13. Slice from approximately 1m depth in Zone 04 (fig. 4). Indications of several buried structures (15-25 X, 15-25 Y; 15-25 X, 50-60 Y) are clear.
PRELIMINARY INTERPRETATION
Although a significant amount of additional processing and examination of the data will be necessary, the initial quality was high enough that indications of buried structures are evident. The following sections represent very preliminary interpretations that will likely be revised many times before a final interpretation is presented.
Preliminary Results of Magnetic Gradiometry
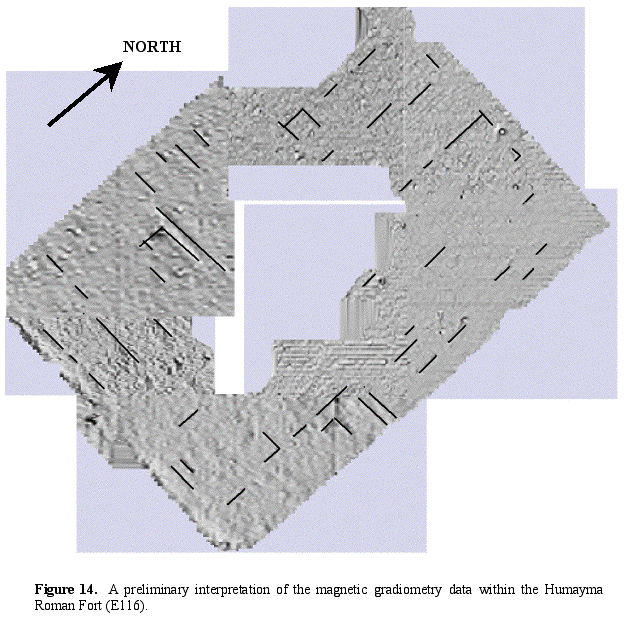
The interpretation of the magnetic gradiometry data consists of identifying coherent, linear anomalies because we have a priori knowledge of the general azimuth of the Roman structures. As previously mentioned, there is significant additional processing that will be applied to the data to improve coherence and reduce the "striping" and other noise. A preliminary interpretation of the magnetic gradiometry data within the Humayma Roman Fort is shown in Figure 14.
Preliminary Results Of Ground-Penetrating Radar
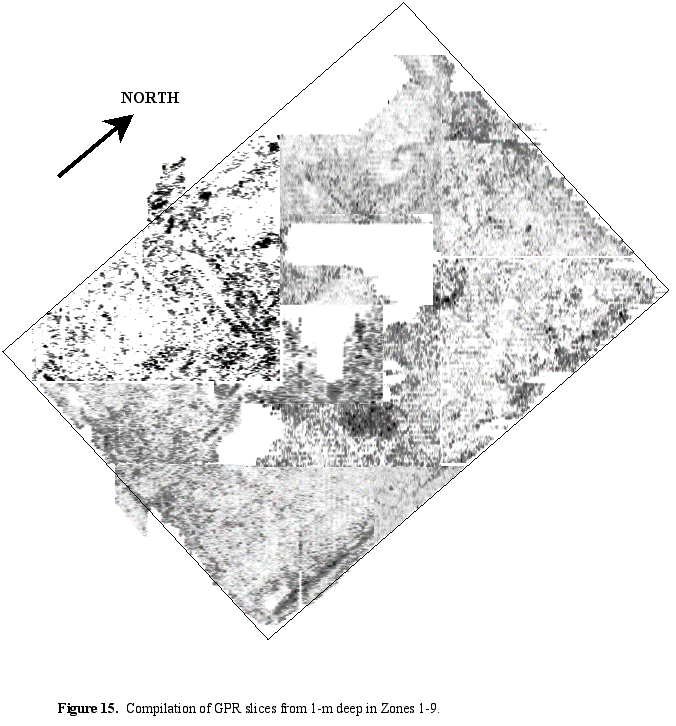
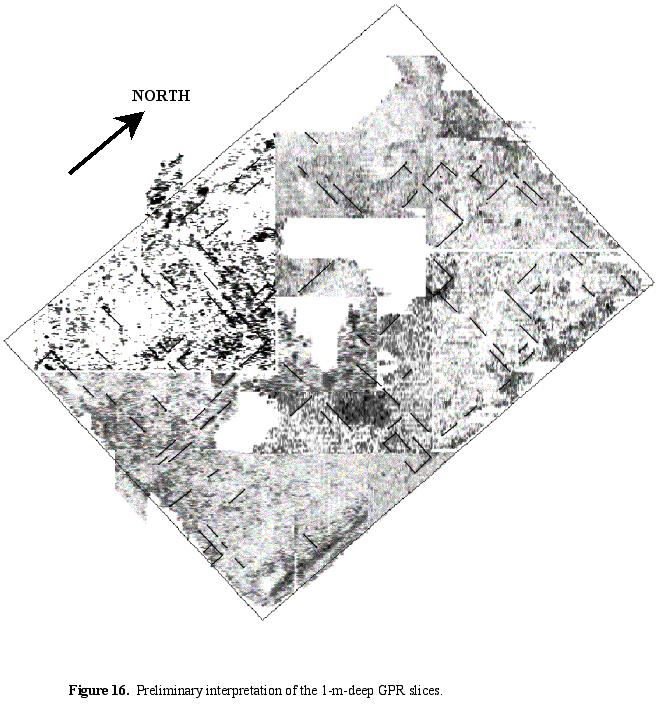
As with the magnetic data, further processing of the GPR data will enhance the signal from buried structures and reduce noise. An uninterpreted mosaic of the GPR data from the nine zones is shown in Figure 15, and a preliminary interpretation of the 1-m-deep slices from the GPR data is shown in Figure 16. Interpretation of the GPR data is quite straightforward, and only structures yielding clear radar returns are indicated.
DATA COLLECTED OUTSIDE THE ROMAN FORT
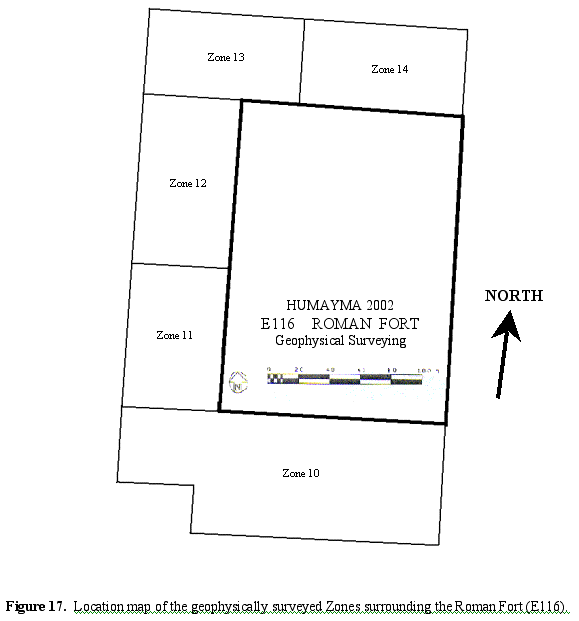
The main objective of the geophysical surveying in the area outside the Fort was to locate external features and stone and mud-brick structures of the vicus. The south, west, and north sides of the Fort were surveyed to a distance of 70m from the inside face of the walls. This region was subdivided into five zones for data collection, numbered Zones 10-14 in a clockwise direction from the south end of the fort (Figure 17).
Site Preparation
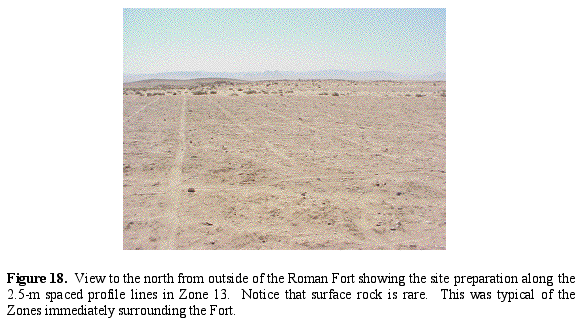
In the region outside the Fort, data were collected along a series of profiles spaced 2.5 metres apart. Previous excavations indicate that the structures outside the Fort are randomly oriented; thus, the profile lines were oriented N-S to simplify surveying. It was impractical to collect 1-m-spaced profiles because of the large area. Changing the spacing to 2.5 metres not only reduced the total linear distance surveyed, but also reduced the time required for stone removal. The area surrounding the fort was relatively free of rock, and only large (>0.25m) pieces had to be moved. Figure 18 shows a view to the north from outside of the Roman Fort showing the site preparation along the 2.5-m spaced profile lines in Zone 13. Notice that surface rock is rare.
PRELIMINARY PROCESSED DATA
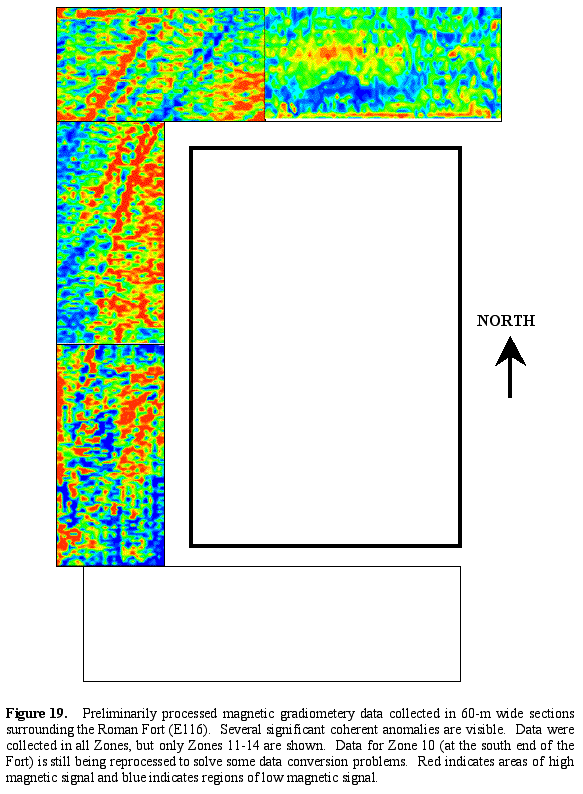
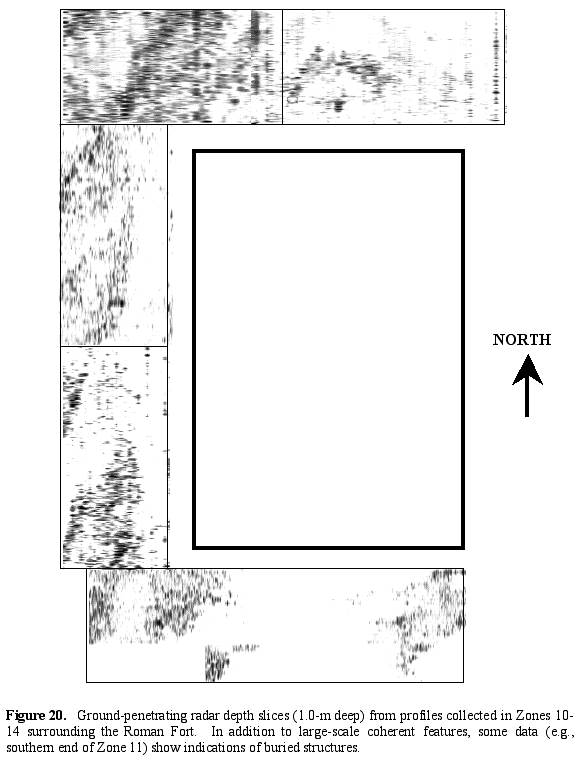
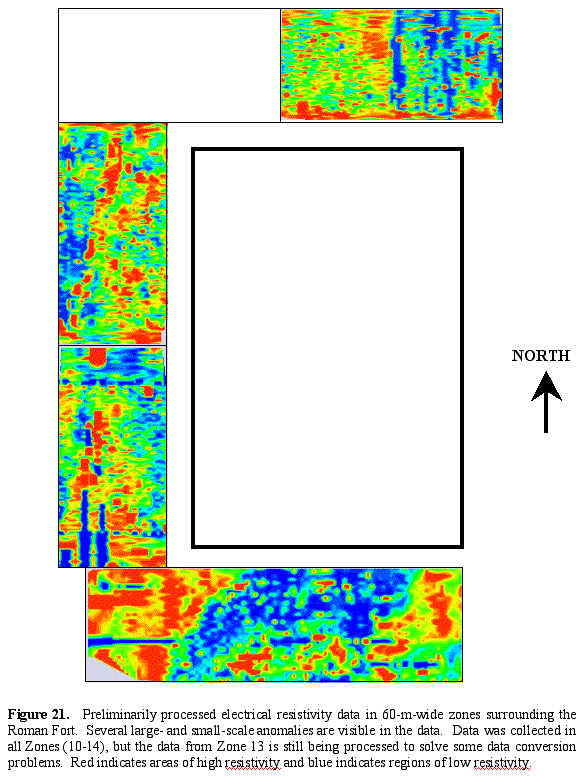
The magnetic gradiometry and GPR data collected outside the Roman Fort were processed in the same manner discussed above. The only exception was that the magnetic data were displayed using a colour-shaded relief map instead of grayscale, because the dispersion of data values was more significant. Figure 19 displays preliminary processing of magnetic gradiometery data collected in 60-m wide sections surrounding the Roman Fort, E116). Data were collected in all zones, but only Zones 11-14 are shown. Data for Zone 10 (at the south end of the Fort) are still being reprocessed to solve some data conversion problems. Red indicates areas of high magnetic signal and blue indicates regions of low magnetic signal. Figure 20 displays ground-penetrating radar depth slices (1.0-m deep) from profiles collected in Zones 10-14 surrounding the Roman Fort. In addition to large-scale coherent features, some data (e.g., southern end of Zone 11) show indications of buried structures. In addition to magnetic and GPR, electrical resistivity date were collected outside the fort and revealed several large- and small-scale anomalies. Figure 21 shows preliminary processing of electrical resistivity data in 60-m-wide zones surrounding the Roman Fort. Data were collected in all Zones (10-14), but the data from Zone 13 are still being processed to solve some data conversion problems. Red indicates areas of high resistivity and blue indicates regions of low resistivity.
The steps necessary for preliminary processed electrical resistivity data were as follows: data transfer from instrument console to laptop computer and input of spatial geometry; removal of spurious data; generation of a color shaded relief map of resistance (color is generally necessary because of the broader dispersion of values).
The following steps will be completed in the near future to enhance the results of the data: integrate the data with the TOPCON survey data to more accurately position the zones relative to each other, including orienting the data to true north; removal of short- and long- wavelength noise and "striping"; determination of the depth of investigation through forward modeling
PRELIMINARY INTERPRETATION
It should be noted again that as in the case of the results presented for the Roman Fort, a significant amount of additional processing and examination of the data is necessary. The following interpretations are based on preliminary processing of the data that will likely be revised many times before a final interpretation is presented.
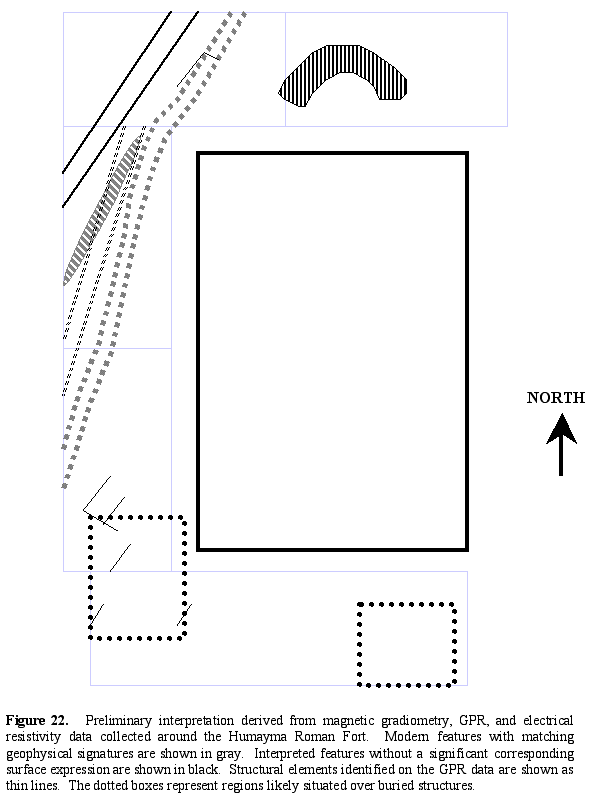
Figure 22 represents a preliminary interpretation of data collected using the magnetic gradiometer, GPR, and electrical resistivity equipment. Modern features with matching geophysical signatures are shown in gray. Interpreted features without a significant corresponding surface expression are shown in black. Structural elements identified on the GPR data are shown as thin lines. The dotted boxes contain probable buried structures. Overall, the interpretations are less specific than those presented for the data inside the Fort, mainly because the 2.5-m profile spacing does not allow for extremely detailed coverage. Some areas are simply highlighted as likely to have buried structures. However, because the data quality is high there are some indications of anomalies on the GPR data with signatures very similar to those produced by the buried structures identified within the Fort.
The features indicated on Figure 22 represent either significant anomalies visible on only one type of data, or less obvious anomalies identified through evaluation of data from more than one geophysical tool. In addition to modern features (modern vehicle tracks, engineered soil), several features that do not have a substantial surface expression were identified.
On Figure 22, the dotted parallel lines represent location of a modern vehicle track, which generated some anomalies on the magnetic and GPR data. The diagonally striped ellipse encloses a region of slightly raised earth (likely created during road repair or plowing in the adjacent field) strongly visible on the magnetic gradiometry data.
In addition to the modern features, several anomalies exist on data from one or more geophysical tools that may represent buried features such as ancient roadways, aqueducts, or structures (shown as solid and dashed parallel lines). There are also indications on the magnetic and GPR data that a semicircular mound outside the north gate of the Fort (vertically striped region on Figure 22 ) may extend below the present land surface.
METHODOLOGICAL CONCLUSIONS
A substantial amount of geophysical data was collected over a three-week period during the summer of 2002. This first large-scale use of multiple geophysical tools at the site yielded important information for future archaeological surveys in general and at Humayma specifically. There are a number of relevant general considerations for archaeological geophysics. Site preparation time at an archaeological site with a rock-strewn surface may be significant, because the use of machinery to clear the site is typically imprudent, requiring removal and clearing by hand. Working time on site will generally be longer than is typical for archaeological excavations because field time is at a premium (mainly due to equipment-related expenses) and data analyses need not be conducted "in country". Sufficient trained staff are required so that major time-consuming errors causing down-time, loss of data, etc. can be minimized. When collecting geophysical data over an extended period of time, it is inevitable that there will be equipment failures, even during normal use-contingency plans and replacement parts are a necessity. The use of multiple geophysical tools is extremely effective because: (1) work can continue even if one tool is down for repairs; (2) some tools are more effective at detecting particular features (e.g., mud-brick, stone, disturbed earth, kilns) than others, and a priori knowledge of what exists at a site is not always available; (3) confidence of interpretations is significantly increased if features can be identified on data acquired by more than one method; and (4) some subtle features can only be identified by examining data from multiple tools. A more effective survey plan can be developed when archaeologists and geophysicists on a team have a solid understanding of each others' disciplines and the major issues involved in collecting, processing, and interpreting archaeological geophysical data.
Considerations specific to Humayma are the following. Although more time consuming (mainly because of the necessary site preparation), GPR was the best tool for locating buried structures, but only if the profile spacing was small (around 1 m). The depth of penetration with the 250 MHz GPR unit was a maximum of 2m and an average of 1.25-1.5m. The magnetic gradiometer generally was only able to detect fairly shallow targets (upper metre) and had signal contamination from modern surface features. The data collected with the capacitively-coupled resistivity meter was useful for identifying deeper targets (>1m), but does not have the vertical or horizontal resolution potential of the GPR. Even in these preliminary stages, more information is available for interpretation through the use of the three geophysical tools than would have been available from any one tool alone
PRELIMINARY ARCHAEOLOGICAL ANALYSIS OF THE SURVEY DATA
Although still only in a preliminary stage of interpretation, the geophysical data have much to suggest about Hawara during the Roman period. Within the Fort, additional evidence has been found which confirms the location and extent of the internal road network as well as the existence of structures in quadrants within which excavation has not yet taken place. The orientation of their identified walls matches the orientation of excavated structures within the Fort, confirming that they belong to buildings of the Roman period. In addition, preliminary data suggest the existence at a deeper level of structures with a different orientation which appear to pre-date the construction of the Fort. Whether these are Nabataean structures which were razed when the Fort was built needs to be confirmed by further refinement of the geophysical data as well as excavation.
Immediately outside the Fort, the data indicates the presence of a dry moat with possibly two phases of construction. In addition, possible claviculae have been identified outside the north and west gates. Two linear anomalies W of the NW corner of the Fort and running from the NE to the SW probably correspond to the Via Nova and the substructure of the aqueduct. Both of these are known to have passed through the site, although their precise routes have not been identifiable until now due to modern surface disturbance and agricultural activities.
Around the Fort, in a region where generally very little can be identified from the surface, the geophysical data suggest the presence of many buildings likely corresponding to the Roman vicus. Past excavation had confirmed the presence of the vicus outside the SW corner of the Fort but geophysical evidence now suggests that the vicus was located around the N, W, and S sides of the Fort as well, a conclusion supported by pottery scatter. (The E side remains to be surveyed in 2003). Interestingly, outside the main (S) wall of the Fort, geophysics suggests buildings were located to the W and E but not immediately outside the south gate. This may correspond with an external market area, a common feature of forts in the Western Roman Empire (Sommer 1999) or may simply be a result of the ploughing which has disturbed the soil in that region.
PLANS FOR SURVEY AND EXCAVATION IN 2003
During the Fall and Winter of 2002 the current data will be subjected to additional processing both by the geophysicists and the archaeologists. In addition, plans are being developed for geophysical surveying and excavation at Humayma in 2003. This work will build on the results obtained thus far. We have a number of objectives for the future: magnetic gradiometric surveying west of the Roman Fort (E116) to locate a potential kiln site; multi-tool geophysical surveying on the east side of the Fort to complete the exterior survey begun this season; detailed (1-m profile spacing) GPR and magnetic surveying in the civilian settlement surrounding the Fort where indications of buried structures have been suggested; detailed GPR surveying outside the Fort in the immediate vicinity of existing excavations showing indications of buried Nabataean structures; detailed multi-tool surveying in locations to be excavated in order to document in detail the ability to locate precisely and identify specific structures (roads, building, cemeteries, stone vs. mud-brick construction, etc.; excavation of a portion of the possible portico associated with the principia; further excavation of the praetorium and its mosaics, and field stabilization of the mosaics before re-burial, in anticipation of construction of a shelter; further excavation of the possible granaries in Area J; excavation along the south end of the Fort reservoir to determine the method of water supply within the Fort; probes to confirm the suggested position of the Via Nova and the aqueduct substructure; excavation of the possible Nabataean structures at the south end of the Roman Bath; c omplete excavation of the shrine room in the Roman residential structure (E125).
BIBLIOGRAPHY
Foote, Rebecca M.
1999 "Frescoes and carved ivory from the Abbasid family homestead at Humeima."Journal of Roman Archaeology 12: 423-28.
Gregory, Shelagh
1996 "Was There an Eastern Origin for the Design of Late Roman Fortifications." Pp. 169-210 in D.L. Kennedy, ed., The Roman Army in the East. Journal of Roman Archaeology, Supp. 18. Ann Arbor: JRA.
Kennedy, David L.
2000 The Roman Army in Jordan. London.
Oleson, John P.
1997 "Landscape and Cityscape in the Hisma: The Resources of Ancient Al-Humayma." Pp. 175-88 in Studies in the History and Archaeology of Jordan, VI. Amman: Department of Antiquities.
2001a "Water-Supply in Jordan through the Ages," pp. 603-14 in B. MacDonald et al. ed., The Archaeology of Jordan. Sheffield: Sheffield Academic Press, 2001.
2001b "King, Emperor, Priest, and Caliph: Cultural Change at Hawara (Ancient al-Humayma) in the First Millennium AD." Pp. 569-580 in Studies in the History and Archaeology of Jordan, VII. Amman: Department of Antiquities.
Forthcoming "'Romanization' at Hawara (Humayma)? The Character of 'Roman' Culture at a Desert Fortress." To appear in Studies in the History and Archaeology of Jordan, VIII. Amman: Department of Antiquities.
Forthcoming Humayma Excavation Project, Final Report, vol. I: The Site and the Water-Supply System. To be published as a Supplement to the Journal of Roman Archaeology.
Oleson, John P., Foote, R., 'Amr, K., Reeves, B., de Bruijn, E., Schick, R.
1999 "Preliminary Report of the al-Humayma Excavation Project, 1995, 1996, 1998," Annual of the Department of Antiquities of Jordan 43: 411-50.
Sommer, C. Sebastian
1999 "The Roman Army in SW Germany as an Instrument of Colonisation: The Relationship of Forts to Military and Civilian Vici." Pp. 81-93 in The Roman Army as a Community. Journal of Roman Archaeology, Supp. 34. Ann Arbor: JRA.