The following is a task provided to students (undergraduate, graduate) and scientists as well as to present and future teachers.
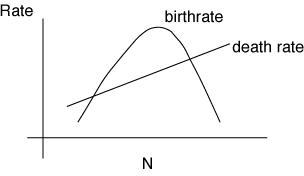
In the derivation of a logistic model, we assume that, as N increased, birthrates decline linearly and death rates increase linearly. Now, let's assume that the birthrate follows a quadratic function (e.g., b = B0 + (kb)N - (kc)N*N), such that the birth and death rates look like the figure. Such a function is biologically realistic if, for example, individuals have trouble finding mates when they are at very low density. Discuss the implication of the birth and death rates in the figure, as regards conservation of such a species. Focus on the birth and death rates at the two intersection points of the lines, and on what happens to population sizes in the zones of population size below, between, and above the intersection points.