Organization of
Data sources
Transcript
M: So
you are bleaching now?
T: Yes,
we are bleaching now.
C: Take
a look here through the ocular. You can see how the outer segments lit up.
M: Oh,
yeah. Ahm.
T: Do
you want the 60 or the 120 seconds?
C: Try
60.
M: You
said here is the base line?
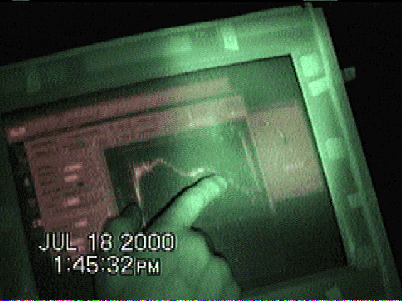
T: This
is probably the baseline here. PICTURE 2 Here in the red
is something happening
00:26:51
that
we have to get to[NOV09-1]. If you take the baseline, this looks like
a very good blue curve. (Moves several times along its outline. PICTURE
3 This seems to be the best way of reading this graph.
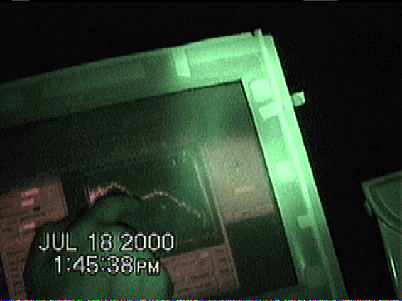
COMMENT: Here, there are two humps.
But one of these humps is NOT a signal, it is noise that T has Ôto get toÕ. The
information Ôsingle coneÕ sets the context in which the signal cannot show a
red signal, for red cones are always paired with green cones--they exist as
double cones.
However,
a double cone can lie on its side--which has happened during the research--so that
it looks like a single cone but then the signal is discrepant with it[NOV08-2].
00:27:15
T: 60
seconds. (Click, clack)
C: Scan.
T: Scan
under way. (Click, clack
T: Do
you see, it changed quite a bit.[NOV08-3]
Usually there is a problem that the scale changes. ThatÕs why it is better to
do it in processing. You see, this is completely gone. (PICTURE 04)
T: (PICTURE
05) So we store that as well. [COMMENT4]
00:28:05
C: Is this last weekÕs MEM?
(0.95)
T: Yes.
(1.78)
C: I
think we ought to make new MEM. [COMMENT5] (While
he is looking through the microscope.)
(0.30)
T: Yeah,
IÕll make new. (1.17) Today is (0.15) yea.
(0.87)
C: This
is roughly a week away from when it was made.
T: Yea,
it is about a week now.
COMMENT: As part of the research, I
have witnessed new tools being introduced, for example, the new monitor so that
the researcher no longer has to look through the ocular but can watch scanning,
bleaching on the monitor. Another modification
introduced pertains to the stabilization of the source in order to rid the
experiment of a particular type of noise. Addition of the x-y stage,
stabilization of the objective, addition of the CCD.[NOV08-6] .
COMMENT: Here, the comment to make
new MEM is significant in terms of what he sees under the microscope. The
comment seems innocuous, but C certainly makes a link between the product that
he has under the microscope and one of the parts of the experimentation. Here,
the scientist is checking on the status of the object after a number of
translations (operations) to ascertain what is assumed to be a continuous
trajectory of the self-same object (here the cell from the eye of a salmonid).
It
is crucial that the scientists knows what happens to his preparation, that he
has a perfect knowledge of the transformations that the preparation undergoes,
as well as perfect knowledge what happens to the signal. The two mediate each
other.
In these situations, graph
reading differs quite significantly from that which we observe when scientists
are asked to read our graphs. (The researcher defined a contractual agreement
with the participant scientists that these will do the activity that.) In the
present situation, the graphs are part of the activity system in which the
researcher is the subject. He changes and modifies the object, knows the
Ôvisual systemÕ by means of which the graph is connected with the original
sample.
Without that knowledge, all
we can do is literal viewing of the graph, describing phenomenal aspects but
not what it might refer to. Traditional research on graphing confounds the
issues in that it assumes that the process by means of which the ÔdataÕ are
collected can be black boxed and seen as transparent. But such cannot be
assumed in understanding scientific reading of graphs, graphs that are novel
(to a certain extent).
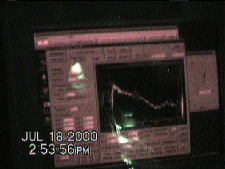
MR: Is this a UV cone?
TH: I think there is a potential hump here and a
little hump there but it is very hard to read.
CH: ¡You need the spectrum¡, to put on
TH: You want to rescan it?
CH: No, go on to another cell. There is too much in
here that I donÕt want to look at.
TH: OK
UV cones are one of the key
features of interest to the research group. Whereas they have other cones, the
still lack a sufficient number of these cones in order to be able to publish
their results. Here, then, Craig has to make a decision whether there is
something, making the data part of the usable data set or whether the effort in
culling the signal from the data is more work than it is worth.
The graph is not easily
interpretable. There might be a signal, then there might be not. ÔIt is very
hard to readÕ. Craig suggests that overlaying the (UV) spectrum might help them
in deciding whether the signal that they are searching, and with it the object,
is actually there or not. But there is Ôtoo much in hereÕ.
Page: 3
[NOV09-1]In this situation,
it is one of the few times that the scientists actually attend to another
signal. Here, the expected signal is in the blue or UV section of the display.
But there is a similarly strong signal (peak) in the red part. So the blue peak
is accepted as being the signal from the cone that C had identified under the
microscope. But the peak in the red part of the spectrum is sufficiently strong
that T considers it worthwhile has having to Ôget to itÕ, that is, making it
the focus of an inquiry in its own right.
Page: 3
[NOV08-2]Here, the
scientists make comparisons between two images as they appear to them, located
at different points in their inquiry Aná..A2áA1 x, for example, ApA10 and ApA5. Because an underlying continuity is assumed, despite the
evident transformation from looking at a cell and looking at a spectrum, itself
the result of a number of physical processes.
Page: 4
[NOV08-3]Scientists also see
a graph in the context of an historically recent graph. Here, T suggests that
Ôit has changedÕ, the hump that was previously there is no longer visible. In
this, the remainder of the graph is assumed to be an invariable and only the
hump has changed, that is, disappeared. This change is attributed back to the
cell, which had been ÔbleachedÕ. Here, scientists establish a causal relation
between the changes in the graph and the operation of bleaching. ÔBleachingÕ is
an experiment in situ that confirms/ disconfirms for the researcher that they
had been looking at a suitable cell in the blue region.
This, in the case of doubt, the scientists here have an opportunity to manipulate the object in order to ascertain the suitability of their interpretation.
There is somewhere another situation in which the hump did not disappear after bleaching telling the scientists that Ôsomething else is going on thereÕ.
Here, T does not make a direct comparison between two graphs, which the scientists nevertheless do when they publish their data. Rather, the peak that had appeared in the left part of the spectrum has now disappeared. (What is going on here, phenomenologically?) A graph that currently appears on the screen can be compared with something in the recent past, still available as if an after image.
Page: 4
[COMMENT4]COMMENT03: When
the ultimate graph is reported, it looks nice and clean. It depicts what the
researchers think is the ÔidealÕ curve, more or less anyway. But what the
(uninformed) reader does not know is how you get from some piece of raw nature,
here the fish, to the ideal graph. What is hidden is the entire sequence of
steps of arriving there, the manipulation of the data, the trajectory of the
piece (retina). It requires knowing the effects each piece of the optics is
doing. Here, optics as a way of talking about the entire laboratory with its
tools, instruments, and established routines and practices. When scientists are
competent, they ÔknowÕ the source of the object, the processes by means of
which the graph is arrived.
When scientists interpret a graph that they do not know or are little familiar with, they at least ÔknowÕ how this graph, such graphs, could have arrived at. They need to be sufficiently familiar with the ways that such graphs come about, how a lab functions. (See Garfinkel 1967and the analysis of hospital records.)
They will be able, there and then, to contrive ways of dealing with these difficulties, and are able to do this because they are able to draw upon their understandings of what things may possibly, and actually, happen in places like scientific laboratoriesÉ (Sharrock & Button, 1991, p. 150)
Page: 4
[COMMENT5]Anywhere along the
line from preparing the fish, that is, dark adapting it to the final graph
could be variations that ultimately have an effect on the particular expression
of the graph. Although the scientist may have some generic graphing skills,
interpreting specific features on any graph requires a deep understanding of
the transformations by means of which a natural phenomenon is converted into a
particular inscription.
In actual scientific work the tool, e.g., a graph, and the phenomenon can change their places such that any one of these can become the focus of the inquiry. When the tool is no longer taken for granted, no longer ready to hand, then the tool becomes the focus of the activity, the object of the activity, and therefore the nature of the activity changes (Heidegger, 1977).
MEM is one of those aspects which, because it is thought to have an effect on the preparation that can go awry and not allow the real signal to show up on the graph. Later, when the signals from the double cones are not very good, that is, when they are broadened, C attributes it to the MEM that destroys the cells. Thus, there is a linkage between unexpected features on the graph and some phenomenon in the world (that is, the fish) or the instrumentation (the optics in the broadest sense).
When we think in terms of students in school, asked to interpret a graph, they are in the precarious situation that they most often do not know such situations as they are asked to make inferences about and how such situations get represented through multiple translations into the graphical feature.
This research appears to assume that interpreting graphs is a simple issue of mapping from source to target domain. It may be that eventually, students may learn to read graphs without knowing how such mappings come about. In the case of the scientists we observed over more than three years now, competence in reading their graphs always came with thorough understanding of the means by which such graphs come about and a thorough understanding of the phenomena. When one or the other was not given, and the scientists unfamiliar or little familiar with the type of graph then considerable problems in reading graphs cropped up.
An interesting case is the isograph, for one might assume that most people are familiar with these from the every day experience of isotherms, isobars, elevation lines in geographic maps etc. Yet despite this familiarity that we might want to inscribe, many scientists struggled considerably when asked to provide a reading of the graph.
Page: 4
[NOV08-6]The entire ÔopticsÕ
undergoes change, which is an aspect of what has to be documented in a cultural
historical approach.